Nigeria has emerged the sole African mention among 20 nations identified as possessing the most remarkable sustainable energy potentials in the world.
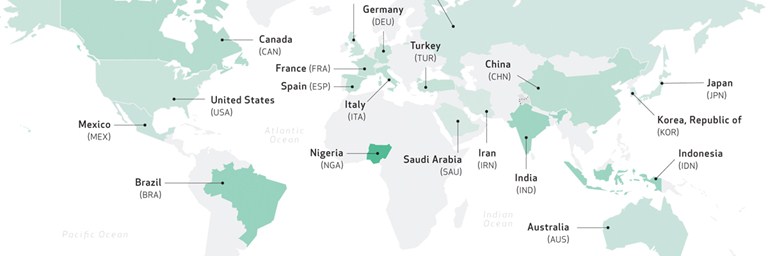
The other countries are: Brazil, Mexico, United States, Saudi Arabia, Canada, France, Spain, Germany, Italy, China, Turkey, United Kingdom, Iran, India, Australia, Japan, Indonesia, South Korea and Russia.
Using the latest energy data from its knowledge partners, Sustainable Energy for All (SEforALL) has launched newly updated “heat maps” on its web site that help identify countries and regions around the world making the most progress – and facing the biggest challenges – on key sustainable energy issues.
The four sets of heat maps are focused on access to clean cooking, electricity access, energy efficiency and renewable energy – all key topics of Sustainable Development Goal 7, which calls for achieving affordable, reliable, sustainable and modern energy for all by 2030. Billions of people lack access to modern energy today.
Each of the heat maps identifies 20 “high-impact” countries facing the biggest challenges on specific sustainable energy indicators. In the case of electricity access and clean cooking, for example, the high-impact countries are all in sub-Saharan Africa and Asia. SEforALL has also posted fact sheets for each indicator, which highlight key trends and countries making the biggest gains.
“By combining and analysing data in these heat maps, we can show global leaders where they can make the biggest and fastest inroads towards our goal of universal energy access for all by 2030,” said Jane Olga Ebinger, Director of Policy at SEforALL, “The maps also show where big gains are happening so that we can replicate the success of others and help leaders in government, business and civil society make smart choices.”
Ebinger will be posting weekly blogs on the heat maps in the coming weeks. SEforALL will also be posting guest blogs from its partners and doing extensive social media promotion via the hashtag #SDG7HeatMaps
Most of the data for the maps is from the 2017 Global Tracking Framework report, which has been assessing progress towards SEforALL objectives since 2013. The Framework uses available data from household surveys and international databases to track access to electricity, clean cooking sources, improvements in energy intensity and increases in the share of renewable energy compared to overall energy consumption.
The maps also draw on data from the Regulatory Indicators for Sustainable Energy – commonly known as RISE – which evaluates 111 countries on the quality of their policies and regulations for energy access, renewable energy and energy efficiency.