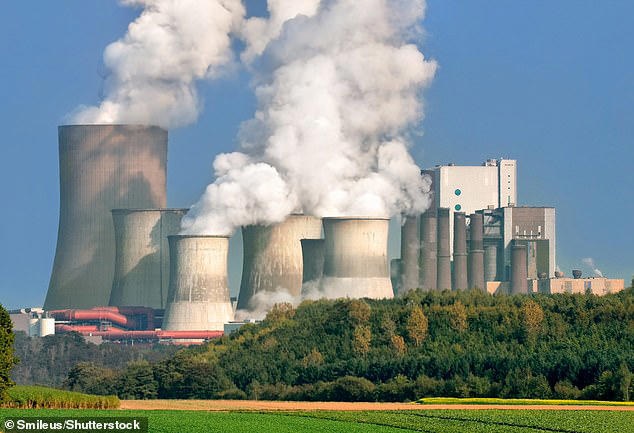
There’s now more carbon dioxide (CO2) in the atmosphere than ever before in human history, scientists have revealed.

For the first time on record, monthly average CO2 levels exceeded 430 parts per million (ppm), according to experts at Scripps Institution of Oceanography in San Diego, USA.
The monthly average for May 2025 reached 430.2ppm – the highest level since accurate measurements began 67 years ago.
The more CO2 in the atmosphere, the higher the rate of global warming, which could one day could make Earth’s surface too hot for humans.
At much higher concentrations, CO2 can also cause a variety of health issues.
Worryingly, this includes cognitive impairment, drowsiness, nausea and even death in the most extreme cases.
“Another year, another record,” said Ralph Keeling, director of the Scripps CO2 Programme.
He added: “It’s sad.”
Like other greenhouse gases, CO2 acts like a blanket, trapping heat and warming the lower atmosphere.
This changes weather patterns and fuels extreme events, such as heat waves, droughts, wildfires, heavy rain and flooding.
Rising CO2 levels also contribute to ocean acidification, which makes it more difficult for marine organisms like crustaceans and coral to grow hard skeletons or shells.
The experts’ new measurements come from Mauna Loa Observatory, a research station situated high on the slopes of the Mauna Loa volcano, Hawaii.
At 11,141 feet above sea level, Mauna Loa Observatory measures different gases in the air by shining different kinds of light and radiation through air samples.
According to the experts, the observatory’s monthly average for May 2025 of 430.2 ppm is an increase of 3.5 ppm over May 2024’s measurement of 426.7 ppm.
Meanwhile, NOAA’s Global Monitoring Laboratory in Boulder, Colorado has separately reported an average of 430.5 ppm – an increase of 3.6 ppm over last year.
In a post on X, Jeff Berardelli, meteorologist and climate specialist for WFLA Tampa Bay, called the new record ‘concerning’.
How is atmospheric CO2 measured?
CO2 is routinely measured in parts-per-million (ppm), which is simply the ratio of one gas or another molecule to another.
For example, 430 ppm of CO2 means that there are 430 molecules of CO2 and 999,570 molecules of other gases or water vapour.
At much higher concentrations – such as 1,000 ppm – CO2 can have a adverse health effect on human functioning, including cognitive impairment, drowsiness and nausea.
A concentration of 40,000 ppm is considered ‘immediately dangerous to life or health’, according to the Minnesota Department of Health.
CO2 is by far the most abundant human-caused greenhouse gas and it can persist in the atmosphere and oceans for thousands of years.
According to scientists, the amount of carbon present now in the Earth’s atmosphere is equal to that which would have been seen some 4.1 to 4.5 million years ago, during a time which scientists refer to as the ‘Pliocene Climatic Optimum’.
At this time, the sea level was a whopping 78 feet (24 meters) higher than in the present day, while the average global temperature stood at 7°F (3.9°C) higher than it was before the Industrial Revolution.
In fact, the temperature was so warm during this period of time that large forests occupied areas of the Arctic which today are barren, chilly tundra.
Although humanity is constantly pumping out CO2 all-year-round, atmospheric CO2 is at its highest in the Northern Hemisphere in the spring – specifically May.
Between autumn and spring, much of the hemisphere’s plant matter decomposes, releasing CO2 into the atmosphere as it does so.
May tends to represent the highest extend of atmospheric CO2 before plants come to life and draw in CO2 to fuel their growth.
This begins the process of lowering the amount of CO2 in the atmosphere until the autumn when the plants start to die – and the cycle continues.
Researchers say Mauna Loa Observatory’s new measurements represent the average state of CO2 in the atmosphere of the Northern Hemisphere.
However, CO2 concentrations have not yet passed the 430 ppm mark in the Southern Hemisphere, which has a reversed cycle.
It was Scripps scientist Charles David Keeling, father of Ralph Keeling, who was the first to recognise that CO2 levels in the Northern Hemisphere peaked in May.
In 1958, he began monitoring CO2 concentrations at Mauna Loa Observatory and documented a long-term increase, known as the Keeling Curve.
NOAA’s Global Monitoring Laboratory, meanwhile, begun daily CO2 measurements in 1974 and has maintained a complementary, independent measurement record ever since.
The Keeling Curve Explained
Regular atmospheric CO₂ recordings were begun on Mauna Loa back in 1958 by the Scripps Institution of Oceanography scientist Charles David Keeling.
It was these measurements that confirmed the prediction of the Swedish physical chemist Svante Arrhenius that humanity was contributing to increasing global temperatures by means of the greenhouse effect.
Specifically, Dr Keeling’s data showed that, overall, atmospheric CO₂ levels were rising each year — a dynamic shown in the so-called keeling curve (pictured bottom left).
The Keeling Curve was also the first data set to reveal the existence of seasonal fluctuations in carbon dioxide levels.
The highest monthly average carbon dioxide value in the northern hemisphere occurs in the May of each year, before plants act to remove large amounts of CO₂ from the atmosphere in the growing season.
The peak in May is caused by plants and soils giving off carbon dioxide between the northern hemisphere’s autumn and early spring.
By Jonathan Chadwick, Mailonline


